
States Clean Energy Efforts Are Lagging
States have a daunting challenge cutting greenhouse gas emissions. In 2020, they relied on carbon fuels for 84% of their primary energy sources, while wind and solar energy only supplied 4.5% of their needs. The states must do more. The U.S. Energy Administration Administration expects CO2 levels will be higher in 2050. The data shows that transitioning to electric vehicles powered by electricity from solar and wind energy is one of the best options to stop carbon emissions.

Data Source from U.S. Energy Information Administration | Chart by Cleantech Adoption LLC
1️⃣ States Set Goals to Reach 100% Net Zero Carbon Emissions
Recent disappointing news from the Supreme Court’s West Virginia Vs. EPA decision and subsequent news that Senator Joe Manchin will not support the Democrat’s climate change legislation has renewed focus on states’ actions to fight climate change. Immediately following the Supreme Court’s decision, the U.S. Climate Alliance, an organization of 24 governors, issued a press release that the states will act to decarbonize electricity generation.
“This [Supreme Court] ruling makes clear that the actions of governors and state legislatures are more important than ever before. Thankfully, state authority to curb greenhouse gas emissions has not changed. Today, we reaffirm our commitment to decarbonizing the power sector using our authority at the state level. We will continue moving forward with bold climate action in the states to protect the health and pocketbooks of the American people. ”
According to the Alliance,
Eighteen members have 100 percent zero-carbon or carbon-neutral electricity goals.
All 24 governors in the Alliance have pledged to reduce greenhouse gas emissions collectively:
26-28% below 2005 levels by 2025,
50-52% below 2005 levels by 2030, and
Net-zero as soon as practicable and no later than 2050.
The states have proposed specific measures for "deploying [emissions reduction] at scale – centered around equity, environmental justice, and a just economic transition – to safeguard public health, grow the U.S. economy, and secure a net-zero future."
2️⃣ But, the 2020 Energy Data Shows States Have Far to Go
Across the 50 states, carbon-emitting energy sources supply 84% of the energy required to meet the U.S. economy's energy consumption. Conversely, zero-emission energy sources contribute only 16% to U.S. energy consumption, with nuclear power contributing almost 60% of the zero-emission mix. Moreover, despite fast growth in many states, solar and wind represent only 4.5% of states' energy mix.

Data Source from U.S. Energy Information Administration | Chart by Cleantech Adoption LLC
3️⃣ Each State’s Zero-Emission Path Is Constrained by Legacy Decisions
State legislators, utilities, public utility commissions, and communities have made decisions spanning decades to approve multiple energy technologies and resources. The objectives for these decisions include:
Lowest electricity supply cost;
Supply reliability;
Energy security and independence; and,
Best cost-effective, available technology.
These goals still apply today, with the over-arching new objective to mitigate the threat of climate change.
Changing the established infrastructure has been done before — telephone land lines, wood-heated homes, central district-heating steam plants, and horse-drawn farm and vehicle equipment, for instance.
Each state has a diverse set of resources to power their economies. This diversity increases the difficulty of finding common ground for policies across the 50 states.
Yet, many of the highest fossil fuel-consuming states are also the leaders in renewable energy adoption (see 2020: Zero-Emissions chart below). Unfortunately, the amount of adoption is still not fast enough.

Data Source from U.S. Energy Information Administration | Chart by Cleantech Adoption LLC
Finding a unifying federal policy to meet decarbonization is not easy. Any change will disrupt incumbent fossil-fuel plant owners and the local communities dependent on their jobs, taxes, and fees, creating political resistance. West Virginia and Wyoming, for example, want to protect their in-state mine owners and utility plants. However, Hawaii and Rhode Island embrace change to free themselves of high-cost imported oil and natural gas.
A list of the states that are most dependent on the three fossil fuels are:
Coal: Two states, West Virginia (52%) and Wyoming (51%), use coal for more than 50% of their energy use. Seven states, North Dakota (43%), Missouri (34%), Kentucky (33%), Utah (28%), Indiana (28%), Nebraska (24%), and Montana (20%), rely on coal for 20% or more of their energy;
Petroleum: All states use oil products for transportation, but a few rely on oil for power generation and home heating. Three states, Hawaii (81%), Vermont (57%), and Delaware (50%), use petroleum in 50% or more of their consumption mix; and,
Natural gas: Natural gas generates electricity and heats homes, meals, and industrial processes. Three states, Alaska (58%), Rhode Island (55%), Mississippi (52%), and the District of Columbia (60%), rely on natural gas for 50% or more of their energy mix.
⏺ Fossil Fuels Dominate Total Energy Consumption
The 2020 EIA energy consumption data chart visually shows how far the states are from decarbonizing their economies.

Data Source from U.S. Energy Information Administration | Chart by Cleantech Adoption LLC
⏺ Nuclear Power Plants Lead Zero-Emission Technologies
The highest fossil-fuel states also have the highest levels of zero-emission energy sources. For the leaders, nuclear energy is a top resource, with wind, hydropower, and solar adding to each state’s mix. Texas stands out with the most wind energy and California with the highest solar energy.

Data Source from U.S. Energy Information Administration | Chart by Cleantech Adoption LLC
⏺ The Transition is Accelerating to Win Jobs and Economic Development Benefits
Are states in competition to create jobs and economic development opportunities in the clean energy economy? Yes! Just look at the announcements to build:
Off-shore wind turbine manufacturing and testing facilities (Massachusetts, Rhode Island, and New York, for instance);
EV battery gigafactories (see chart);
EV car plants (13 carmakers have announced plans to spend more than $75 billion to open electric vehicle manufacturing plants in six states;
Solar PV manufacturing (“$171 million expansion of Q Cells’ existing solar module manufacturing plant in [Georgia], " will create 470 additional jobs. Total local Q Cells employees will exceed 1,000 when the expansion is complete.”)
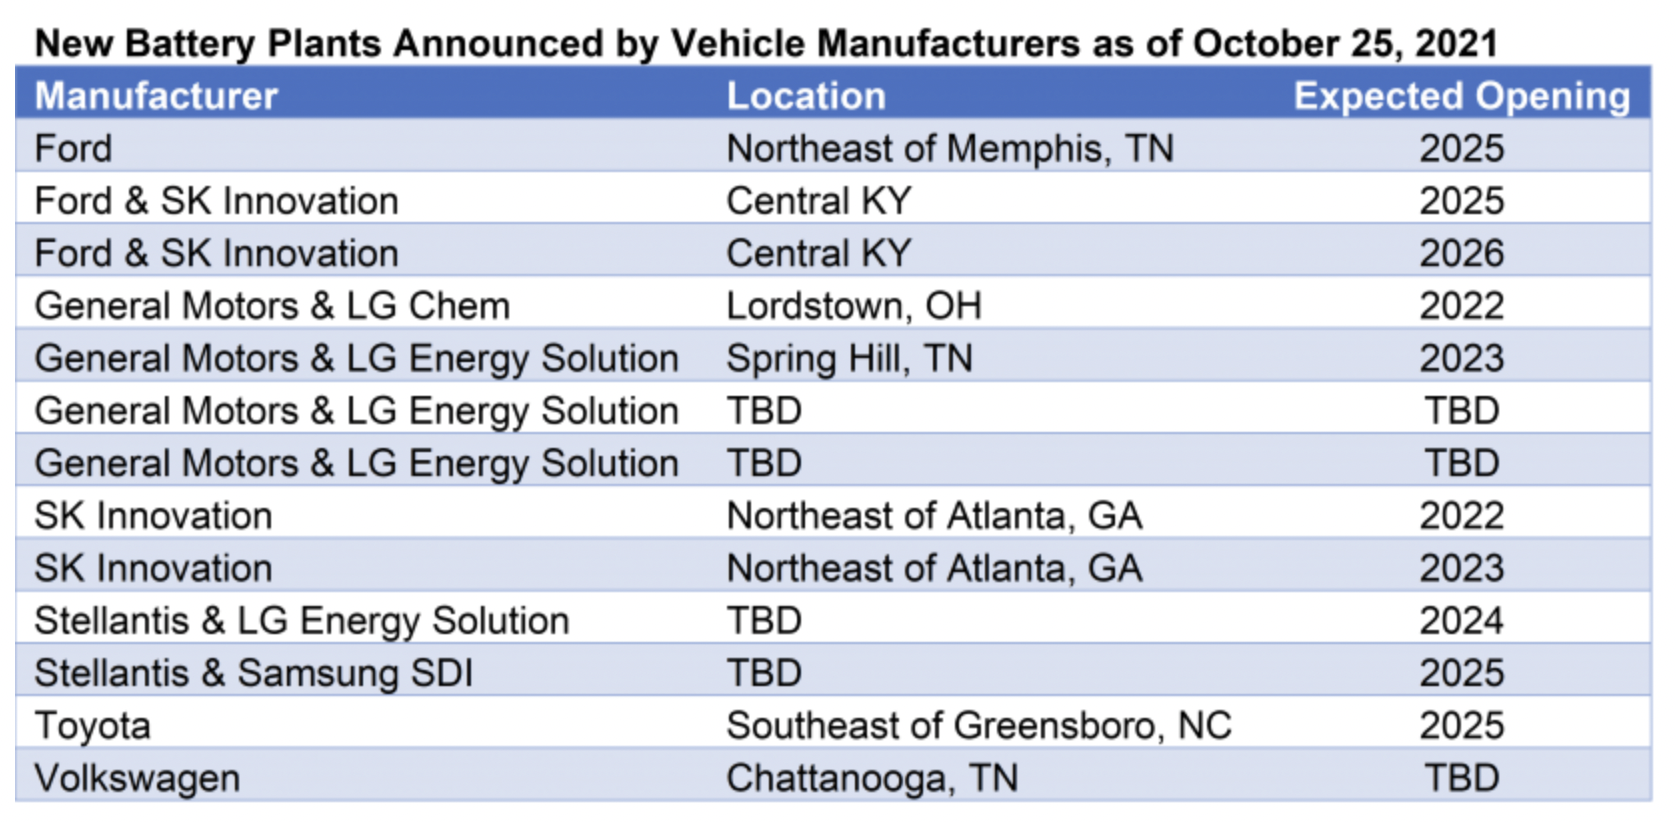
Department of Energy from sources: Crain Communications, Automotive News, "Battery plants in the works," October 25, 2021, p. 8. https://www.energy.gov/eere/vehicles/articles/fotw-1217-december-20-2021-thirteen-new-electric-vehicle-battery-plants-are
4️⃣ Despite the Clean Energy Transition, EIA Predicts Rising CO2 Levels
First, the good news: the U.S. Energy Administration (EIA) forecasts faster growth for solar and wind energy, reaching 44% of total U.S. energy consumption.
However, natural gas and petroleum are the highest-use fuels, which is why the CO2 levels increase (see charts below). In addition to electricity and transportation, these fuels supply growing industrial processes and chemical feedstock plants.
State policies cannot change chemical and industrial processes, but they can affect the selection of power generation and transportation fuels. Therefore, states must take more steps to transition these sectors from fossil fuel energy.

Data Source from U.S. Energy Information Administration | Annual Energy Outlook 2022 | https://www.eia.gov/outlooks/aeo/narrative/consumption/sub-topic-02.php
⏺ Zero-Emission Electricity Grows, But Not Enough to Meet Power Demand Growth
Again, some good news: the EIA forecasts that carbon-free energy will generate 56% of our electricity in 2050 compared to 40% in 2021. However, natural gas use for electricity generation also increases. The forecast assumes both energy sources are needed to meet electricity demand growth and replace retiring coal, nuclear, and older gas power plants.

Data Source from U.S. Energy Information Administration | Annual Energy Outlook 2022 | https://www.eia.gov/outlooks/aeo/pdf/AEO2022_ChartLibrary_Electricity.pdf
⏺ And Vehicles are Moving Away from Gasoline, But at a Slow Pace
Due to the large, legacy ownership base of internal combustion vehicles, the EIA forecasts that gasoline use in 2050 will still be higher than in 2010. Although EIA predicts EV sales will increase rapidly, their growth will not be enough to displace gasoline-powered cars.
However, new EV sales growth might be faster than EIA expects. A recent Bloomberg analysis, US Crosses the Electric-Car Tipping Point for Mass Adoption, shows that 5% of new US car sales were electric vehicles (EV) in the fourth quarter of 2021, signaling a rapid adoption of EV cars by consumers. According to Bloomberg analysts, the 5% threshold is when mainstream buyers start adopting any new technology. Based on other countries, EV adoption rates could grow to 25% of the new car market in 2025. For example, Norway, China, and Iceland have rapidly increased EV car sales once passing the 5% threshold. So, possibly, the EIA forecast will be too conservative. More analysis is required.
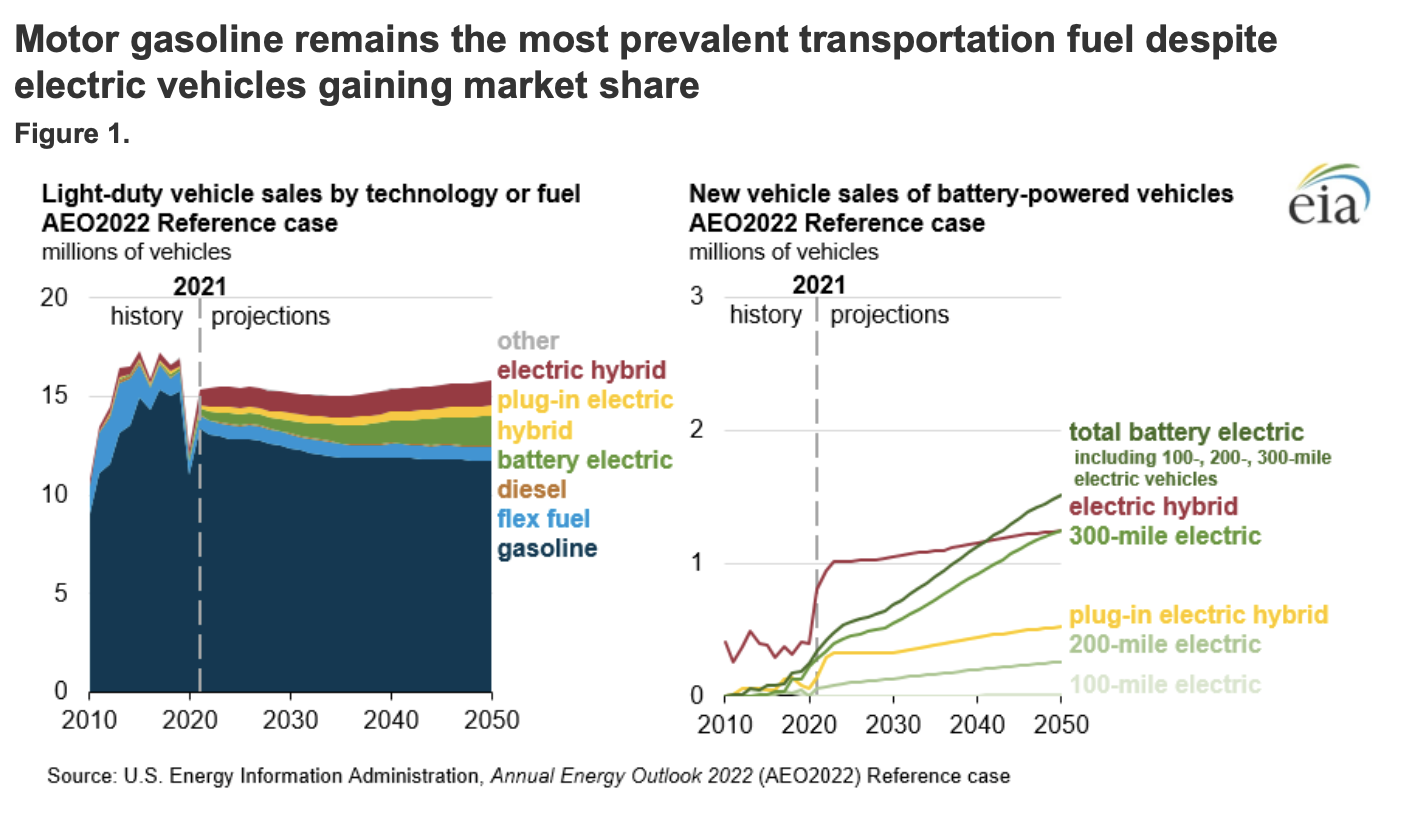
Data Source from U.S. Energy Information Administration | Annual Energy Outlook 2022 | https://www.eia.gov/outlooks/aeo/narrative/consumption/sub-topic-01.php
5️⃣ More Aggressive Steps Are Needed To Decarbonize Each State
Energy forecasts are often wrong, as was proven decades ago by Cambridge Energy Research Associates (CERA), now part of S&P Global, in a famous analysis of oil prices predictions. The problem with forecasts is that they use econometric models that project historical trends and then assume known incremental changes, like high or low prices. As a practical matter, the estimates cannot guess “Wild Cards” (unimagined changes), government policy changes, wars, country competition, or technology disruptions.
However, the forecasts provide guideposts for planning policy priorities to speed the transformation to clean energy, given current knowledge of technology, policy, and market trends.
6️⃣ In the Next Couple of Decades, Policy Options are Limited
⏺ New Nuclear Power Plants Will Not Get Built at Scale
As a practical matter, no new, large nuclear power plants will be built after the Georgia Power Vogtle plants eventually come online. However, several states are permitting the next generation of smaller nuclear power plants, which will take almost a decade, if all goes well, to start operations:
“TerraPower recently announced plans to build its [345 MW] Natrium reactor near a retiring coal plant in Kemmerer, Wyoming” (Source: DOE). “TerraPower anticipates submitting the demonstration plant’s construction permit application to the NRC in mid-2023. The plant is expected to be operational in the next seven years, aligning with the ARDP schedule mandated by Congress.” If this technology is successful, more plants could be developed, sited, permitted, interconnected, and built at other locations, maybe in West Virginia. West Virginia passed a law in February 2022 to end its state’s ban on nuclear energy construction.
“Along with [TerraPower’s] Natrium, two other advanced reactors are also expected to operate in the Northwest region. X-energy announced its plans to site its Xe-100 reactor in the state of Washington, and NuScale plans to operate its first advanced small modular light water reactor system at Idaho National Laboratory—making this region the new hub of nuclear innovation.” (Source: DOE)
⏺ And Don’t Count on New U.S. Hydropower
In 2016, the Department of Energy released a report, “Hydropower Vision: A New Chapter for America’s 1st Renewable Electricity Source.” The study envisioned “that U.S. hydropower could grow from 101 gigawatts (GW) of capacity in 2015 to nearly 150 GW by 2050.” Yet, severe drought in the Southwest and Northeast is lowering lakes, rivers, and streams of their water resource. Under these conditions, permitting and financing dams is not practical.
⏺ The Best Near-Term Option: Electric Vehicles Powered by Solar & Wind Energy
Governors and their state legislators should audit the policies that will create jobs, economic development, and the adoption of clean energy technologies. Then, each year, they should report on the success of their transition, showing the percentage of energy sources met by fossil fuels versus the sources supplying zero-emission fuels, compared to the goals they set for their states.
Coal plants are retiring, and coal use is falling. But petroleum use is not declining, and natural gas use is increasing. The two broad policy actions are, therefore:
Speed the conversion of gas and diesel-powered vehicles to electric vehicles to cut petroleum use faster; and
Speed the adoption of solar energy and wind power to clean up the grid power for electric cars.
Please send your thoughts, ideas, and suggestions for future research to Questions.